
Documentation for Climate Reporting
Climate Reporting helps small and medium-sized businesses meet their sustainability requirements by automating greenhouse gas accounting using data already available in their various IT systems
What is Greenhouse gas accounting?
Greenhouse gas (GHG) accounting is the process of measuring, tracking, and reporting the amount of greenhouse gases emitted by a business. It allows businesses to identify their emission sources, set reduction targets, comply with environmental regulations, and demonstrate their commitment to sustainability. As countries and corporations try to strengthen their climate policies and reduce environmental impact, standardised GHG accounting provides valuable data that supports informed decision-making and credible climate action.
Various standards offer companies guidance on how to account and report GHG emissions (see our support article for an overview). The most widely used standard is the GHG Protocol Corporate Accounting and Reporting Standard. Read our guide about the standard and how to use it.
More than 40 countries now legally require the reporting of GHG emissions. Large companies within the European Union (EU), as well as non-EU companies with significant business operations in the EU, must disclose their emissions as mandated by the Corporate Sustainability Reporting Directive (CSRD). This directive was incorporated into the Norwegian Accounting Act in 2024. For smaller companies, it is recommended to report under the simpler Voluntary Standard for SMEs (VSME).
Greenhouse gas accounting in Climate Reporting
Climate Reporting follows the principles and guidelines established by the GHG Protocol. The platform enables companies to calculate their GHG emissions, analyse synchronised emissions data in an interactive dashboard and generate greenhouse gas reports compliant with ESG frameworks that can be shared with various stakeholders.
Methods to calculate greenhouse gas emissions
There are two primary methods for calculating greenhouse gas emissions: the spend-based method and the activity-based method. The main difference between these methods is the type of input data and emission factors they use.
Input data types
- Primary data:
- includes data measured by the reporting company or provided by suppliers that directly relate to specific activities in the reporting company’s value chain.
- Primary activity data may be obtained through meter readings, purchase records, utility bills, engineering models, direct monitoring or mass balance.
- Secondary data:
- includes industry-average-data (e.g., from published databases and government statistics), financial data, proxy data, and other generic data
Emission factor types
An emission factor quantifies the greenhouse gas emissions produced per unit of a given activity. Examples of such activities include driving a vehicle, burning fuel in a boiler, or the money spent on goods and services.
- Primary emission factors:
- These factors are derived from direct measurements or primary data sources specific to a company’s own operations, suppliers, or products. They provide accurate, activity-specific information that reflects actual emissions from particular processes or supply chain entities.
- Examples are: product-level data from suppliers, environmental product declarations or site-specific energy use or emissions data.
-
Secondary emission factors:
-
- These factors are derived from generalised industry averages, scientific literature, databases, or proxy data. These factors are not specific to a single company’s activities but represent broader approximations based on sector-level or regional averages.
- Can be of two types: activity-based (kg CO₂e per liter of fuel consumed) and spend-based (kg CO₂e per money spent). More information on activity-based secondary emission factors can be found in our API documentation.
- Useful when primary data is unavailable or impractical to collect, offering a scalable, cost-effective way to estimate emissions with less accuracy.
- Examples are: national and industry average emission factors, lifecycle assessment studies, Environmentally Extended Input Output (EEIO) emission factors.
Calculation methods
- Spend-based method:
- Emissions are calculated using financial data (e.g., how money spent on goods or services) multiplied by spend-based emission factors (kg CO₂e per money spent).
- This approach is straightforward, as it requires minimal data input from the user, yet comprehensive, since it captures emissions by drawing on all financial transactions recorded in the accounting system. However, it is less precise because it depends on generalised assumptions and emission factors.
- Activity-based methods:
- Emissions are calculated using physical data (directly measured or estimated), like liters of fuel consumed or numbers of products purchased, multiplied by emission factors (kg CO₂e per kilometers travelled). Recommended by the GHG Protocol. Includes:
- Average-data: A subset of activity-based calculations where primary (measured diesel consumption) or secondary (like diesel consumption estimated from fuel receipts) activity data is combined with activity-based emission factors (like kg CO₂e emitted per liter of diesel burnt).
- Supplier-specific: A subset of activity-based calculations where primary activity data is combined with supplier-specific emission factors, for example an environmental product declaration compiled by a supplier or emission factors obtained directly from suppliers.
- Hybrid: Combines supplier-specific data (where available) and compliments it with secondary data.
- Emissions are calculated using physical data (directly measured or estimated), like liters of fuel consumed or numbers of products purchased, multiplied by emission factors (kg CO₂e per kilometers travelled). Recommended by the GHG Protocol. Includes:
Calculation method in Climate Reporting
To balance accuracy and practicality,Climate Reporting uses both the spend-based and average-data methods. The process begins with extracting financial data from your company’s general ledger to generate initial emissions estimates using the spend-based method. These estimates are then refined by incorporating primary, activity-based data where available, replacing the spend-based estimates to improve accuracy. This approach allows broad, high-level coverage from utilising spend data while enhancing precision using more specific activity data when possible.
Chart of accounts and general ledger
Climate Reporting makes use of a company’s chart of account and general ledger to calculate emissions.
A chart of accounts (CoA) is the structured list of all the accounts a business uses to categorise its financial transactions. Accounts are categorised by type, including assets, liabilities, equity, revenue, and expenses. For both accounting and sustainability reporting, it is important to record each transaction in the most appropriate ledger account. In Norway, most accounting softwares offer charts of account templates maintained by Regnskap Norge or Standard Norge. These serve as blueprints for organising company finances, though businesses retain a degree of flexibility to modify existing accounts or add new ones.
Meanwhile a general ledger (GL) is the complete record of all financial transactions for a business. It contains every debit and credit entry across all accounts, along with running balances, so you can see the full financial picture at any point in time.
All companies are required to assign a standardised SAF-T account ID to each account in the CoA in order to generate tax reports upon request from Skatteetaten (the Norwegian Tax Administration). As a result, all Norwegian accounting systems can produce a comparable SAF-T report file which can serve as a foundation for developing simple, yet comprehensive and comparable, greenhouse gas accounting.
This is done through mapping each SAF-T to appropriate spend-based emission factors. Take for example, account 7155 which (in SAF-T v1.3) contains travel-related expenses like hotel stays, travel tickets and food. In this case, the account is mapped to emission factors related to the hospitality and transport sectors. Accounting practices have a substantial effect on emissions, so make sure to read our guide about smart accounting practices before starting reporting.
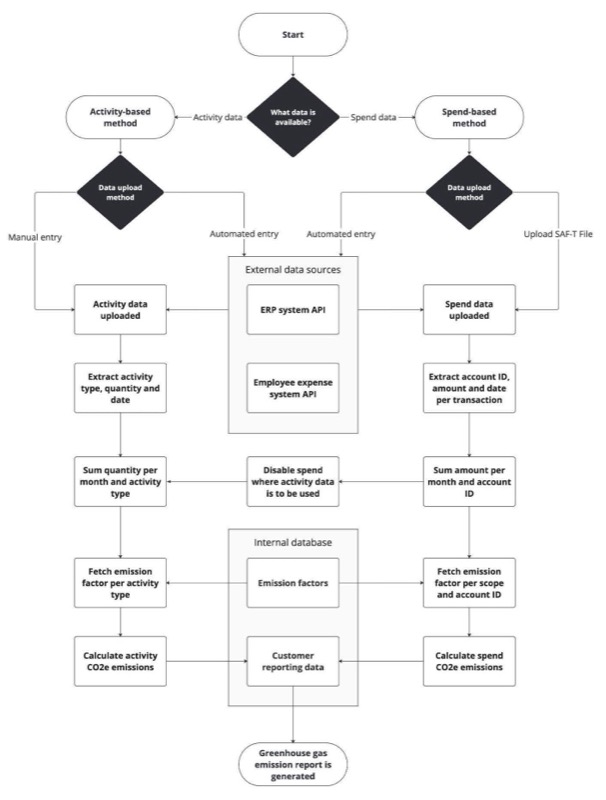
The logic flow for calculating emissions in Climate Reporting:
- The customer’s financial data is made available to Climate Reporting. This can be done in one of two ways:
- Climate Reporting fetches data directly from a supported ERP (currently Business NXT, Visma Net or Tripletex)
- The customer uploads their financial report to Climate Reporting as a SAF-T file.
- Relevant information for calculating greenhouse gas emissions is extracted. This means transactions from expense accounts, including the following fields for each transaction
- Account ID (as defined in the ERP)
- SAF-T Account ID and version
- Amount (in a defined currency)
- The date the purchase was made
- The net monthly amount per SAF-T account is calculated by summing all transactions
- The aggregated transactions are multiplied by the relevant emission factor to calculate greenhouse gas emissions.
- Next, the spend-based emission estimates can be refined by supplementing with activity data. This can be done in one of three ways:
- Climate Reporting fetches spending data from a supported system and converts it into consumption data (only for fuel and energy consumption).
- The user inputs consumption data manually (currently available for fuel and energy).
- Climate Reporting extracts detailed travel data from a supported system (kilometers travelled in a specific mode of transport).
- Relevant information for calculating greenhouse gas emissions is extracted.
- The activity quantities are aggregated multiplied by the relevant emission factor for that activity type.
- Emissions calculated using activity-based data replace spend-based estimates wherever applicable.
- Updated data is now available to get an overview and export reports
Output report format
Climate Reporting outputs a spreadsheet report (XLSX format) with data presented in a structured, readable, and audit-friendly format. The report includes the following tabs:
- Info: Detailed information about the report, including reporting period and timestamp, calculation methods, report type, company information, and supporting documentation.
- Emissions by account: Breakdown of gross greenhouse gas emissions (in tonnes CO2e) by month and SAF-T account.
- Emissions by scope: Breakdown of gross scope 1, 2, and 3 greenhouse gas emissions (in tonnes CO2e) by month.
- Business travel: Detailed breakdown of greenhouse gas emissions from business travel (Scope 3.6) by category, including air, rail, water and road travel, plus hotel stays.
- Energy consumption by source: Detailed breakdown of energy consumption by fuel and energy source inputs
- Energy consumption: Aggregated breakdown of energy consumption in accordance with the energy disclosure requirement (E1-5) mandated by the ESRS.
- Appendix: Additional information useful for auditing purposes, including calculation inputs, methodologies used and data sources.
The report is based on the GHG Protocol Corporate Accounting and Reporting Standard and is designed to support CSRD and VSME reporting requirements. Reports are structured to support human readability making them suitable for internal analysis, audits, and external sustainability reporting. References and documentation are included in the report to strengthen transparency and simplify review and assurance processes.
What Scopes have been included and excluded?
Scope 1
| Scope 1 category | Description | Status |
| Mobile combustion | Emissions from the use of fuel in mobile assets owned by the company (cars, buses, aeroplanes etc.) | Included (average-data method) |
| Stationary combustion | Emissions from the use of fuel in stationary assets owned by the company (boilers, engines, incinerators and process heaters etc.) | Included (average-data method) |
| Fugitive emissions | Direct greenhouse gas emissions not caught by a capture system which are often due to equipment leaks, evaporative processes and windblown disturbances | Coming soon |
How are Scope 1 emissions calculated in Climate Reporting?
Directly measured or estimated fuel consumption is multiplied with activity-based emission factors (e.g. kg CO₂e per liter of fuel consumed).
If no manual input is available (Estimating fuel consumption from fuel spend)
- In this scenario, fuel consumption is estimated from fuel spend. Fuel use is estimated by dividing the spending on different fuels by the average fuel price of the fuel. Spending on fuels is tracked using specific SAF-T accounts: For SAF-T v1.3, these are account numbers: 6200 (Power and fuel for manufacture) and 7000 (Fuel, means of transport).
- A mapping has been established between SAF-T accounts and different fuel types, which determines the proportion of total spending allocated to each fuel (based on SSB’s statistics on energy consumption in Norway).
- Once the expenditure is attributed to each fuel, it is divided with the corresponding fuel price to estimate fuel consumption. The fuel prices are updated annually.
- Each fuel’s consumption is then multiplied by its corresponding activity-based emission factor to calculate CO₂e emissions.
- Finally, emissions are summed for all the different fuel types and aggregated as per aggregation categories defined in the European Sustainability Reporting Standards (ESRS).
If manual input is available (Directly measured fuel consumption)
- In this scenario, users manually enter directly measured fuel consumption in appropriate units (kWh, litres, cubic meters, or kilograms). Users must assess all fuel types that are tied to the above-mentioned SAF-T accounts, and replace spend-based estimates by measured data, in order to avoid double counting.
- Each fuel’s consumption is first converted into kWh, and then multiplied by its corresponding activity-based emission factor (in CO2e per kWh) to calculate CO₂e emissions.
- Finally, emissions are summed for all the different fuel types and aggregated as per aggregation categories defined in the ESRS.
For a deep dive into Scope 1 emissions, refer to our support article.
Scope 2
| Scope 2 category | Description | Status |
| Location-based method | Emissions from the purchase of electricity, heating, cooling and steam based on the average emissions intensity of the grid where the energy consumption occurs | Included (average-data method) |
| Market-based approach | Emissions from the purchase of electricity, heating, cooling and steam based on the type of contractual arrangements a company has made to purchase energy. This includes purchases of green energy certificates or agreements with specific energy suppliers | Included (average-data method) |
How are Scope 2 emissions calculated in Climate Reporting?
Climate Reporting can calculate Scope 2 emissions using both location-based and market-based approaches. Directly measured or estimated energy consumption is multiplied with activity-based emission factors (e.g. kg CO₂e per kWh of electricity consumed).
If no manual input is available (Estimating energy consumption from energy spend)
Location-based approach
- In this scenario, energy consumption is estimated from energy spend: by dividing the spending on energy by the average price of energy (updated annually).
- Energy-related expenses are identified in the financial accounts. For SAF-T v1.3, the relevant accounts are: 6200 (Power and fuel for manufacture) and 6340 (Lighting and heating). These SAF-T accounts are mapped to specific energy types to determine how total spending is distributed across different forms of purchased energy.
- Expenditures attributed to each energy type are then divided with the corresponding energy prices to estimate energy consumption.
- Consumption is then multiplied by its corresponding location-based emission factors to calculate CO₂e emissions. Example: In Norway in 2024, emissions from purchased electricity are calculated as: total electricity consumption (with and without guarantees of origin) × 11.9 g CO₂e/kWh (emission factor from NVE).
- Finally, emissions are summed for all the different energy types and aggregated as per aggregation categories defined in the ESRS.
Market-based method
- Steps 1 to 3 are the same as for the location-based method.
- In the market-based approach, electricity (or other utilities) covered by guarantees of origin is assigned the emission factor specified in the contractual instrument, typically 0 g CO₂e/kWh, as guaranteed energy is renewable. Energy not covered by guarantees is assigned the residual mix emission factor (e.g., 535 g CO₂e/kWh for electricity in Norway in 2024).
- Total market-based emissions are obtained by summing emissions from guaranteed and non-guaranteed portions.
Note: When relying on financial data, it is not possible to determine whether energy purchases include guarantees. The tool therefore assumes all energy is without guarantees and applies the residual mix emission factor. This can be overwritten by manually inputting energy consumption in the tool.
- Finally, emissions are summed for all the different energy types and aggregated as per aggregation categories defined in the ESRS.
If manual input is available (Directly measured energy consumption)
Location-based approach
- Users manually enter energy consumption in units such as kWh, including any energy purchased with guarantees.
- Each energy type’s consumption is multiplied by its corresponding location-based emission factor to calculate CO₂e emissions. Example: In Norway, emissions from purchased electricity are calculated as: total electricity consumption (with and without guarantees of origin) × 11.9 g CO₂e/kWh (emission factor from NVE).
- Finally, emissions are summed for all the different energy types and aggregated as per aggregation categories defined in the ESRS.
Market-based approach
- Step 1 is the same as the location-based method.
- Energy covered by guarantees of origin is assigned the emission factor specified in the contractual instrument, most often 0 g CO₂e/kWh. Energy not covered by guarantees is multiplied by the residual mix emission factor (e.g., 535 g CO₂e/kWh for Norwegian electricity in 2024).
- Finally, emissions are summed for all the different energy types and aggregated as per aggregation categories defined in the ESRS.
For detailed information about Scope 2 emissions and allocation methods, refer to our support article.
Scope 3
Scope 3 is broken into 15 categories by the Greenhouse Gas Protocol to help companies comprehensively assess and manage their indirect GHG emissions. The first eight categories are upstream of the company (related to purchased goods and services) and the last seven downstream (related to sold goods and services). For a deeper dive into the 15 categories, refer to our Scope 3 article here.
| Scope 3 category | Description | Minimum boundary | Status | |
| 1. | Purchased goods and services | Emissions from the production of goods and services a company buys (raw materials, components, etc.) | All upstream (cradle-to-gate) emissions of purchased goods and services | Included (spend-based) |
| 2. | Capital assets | Emissions from producing equipment, machinery, buildings, etc., that a company purchases | All upstream (cradle-to-gate) emissions of purchased capital assets | Coming soon |
| 3. | Fuel and energy-related activities | Emissions related to the extraction, production, and transportation of fuels and electricity purchased and consumed by the reporting company | For upstream emissions of purchased energy: All upstream (cradle-to-gate) emissions of purchased fuels (from raw material extraction up to the point of, but excluding combustion) For T&D losses: All upstream (cradle-to-gate) emissions of energy consumed in a T&D system, including emissions from combustion | Included (average-data method) |
| 4. | Upstream transportation and distribution | Emissions from the transportation and distribution of products purchased by the company, including warehousing | The Scope 1 and 2 emissions of transportation providers that occur during use of vehicles and facilities Optional: The life cycle emissions associated with manufacturing vehicles, facilities, or infrastructure | Included (spend-based) |
| 5. | Waste generated in operations | Emissions from the disposal and treatment of waste generated by the company’s operations | The Scope 1 and 2 emissions of waste management suppliers that occur during disposal or treatment Optional: Emissions from transportation of waste | Coming soon |
| 6. | Business travel | Emissions from employee travel for business purposes, such as flights, car rentals, and train rides | The Scope 1 and 2 emissions of transportation carriers that occur during use of vehicles (e.g., from energy use) Optional: The life cycle emissions associated with manufacturing vehicles or infrastructure | Included (spend and average-data method) |
| 7. | Employee commuting | Emissions from employees travelling between their homes and workplaces | The scope 1 and scope 2 emissions of employees and transportation providers that occur during use of vehicles Optional: Emissions from employee teleworking | Excluded for now |
| 8. | Upstream leased assets | Emissions from the operation of assets leased by the company (if not already included in Scope 1 or 2) | The scope 1 and scope 2 emissions of lessors that occur during the reporting company’s operation of leased assets (e.g., from energy use) Optional: The life cycle emissions associated with manufacturing or constructing leased assets | Included (spend-based) |
| 9. | Downstream transportation and distribution | Emissions from the transportation and distribution of products sold by the company to end customers (after the point of sale). | The Scope 1 and 2 emissions of transportation providers, distributors, and retailers that occur during use of vehicles and facilities (e.g., from energy use) Optional: The life cycle emissions associated with manufacturing vehicles, facilities | Excluded for now |
| 10. | Processing of sold products | Emissions from the processing of intermediate products sold by the company (if the product requires further processing by customers). | The Scope 1 and 2 emissions of downstream companies that occur during processing (e.g., from energy use) | Excluded for now |
| 11. | Use of sold products | Emissions that result from the use of products sold by the company (for products that require energy, such as appliances or vehicles) | The direct use-phase emissions of sold products over their expected lifetime (i.e., the Scope 1 and 2 emissions of end users that occur from the use of: products that directly consume energy (fuels or electricity) during use. Optional: The indirect use-phase emissions of sold products over their expected lifetime (i.e., emissions from the use of products that indirectly consume energy during use) | Excluded for now |
| 12. | End-of-life treatment of sold products | Emissions from the disposal and treatment of products sold by the company at the end of their life cycle (recycling, landfill, etc.) | The Scope 1 and 2 emissions of waste management companies that occur during disposal or treatment of sold products | Excluded for now |
| 13. | Downstream leased assets | Emissions from the operation of assets owned by the reporting company and leased to other organisations | The Scope 1 and 2 emissions of lessees that occur during operation of leased assets (e.g., from energy use). Optional: The life cycle emissions associated with manufacturing or constructing leased assets | Coming soon |
| 14. | Franchise | Emissions from the operations of franchises that are not included in Scope 1 or 2 | The Scope 1 and 2 emissions of franchisees that occur during operation of franchises (e.g., from energy use) Optional: The life cycle emissions associated with manufacturing or constructing franchises | Excluded for now |
| 15. | Investments | Emissions from investments the company makes (such as equity, debt investments, and project finance) | Excluded for now |